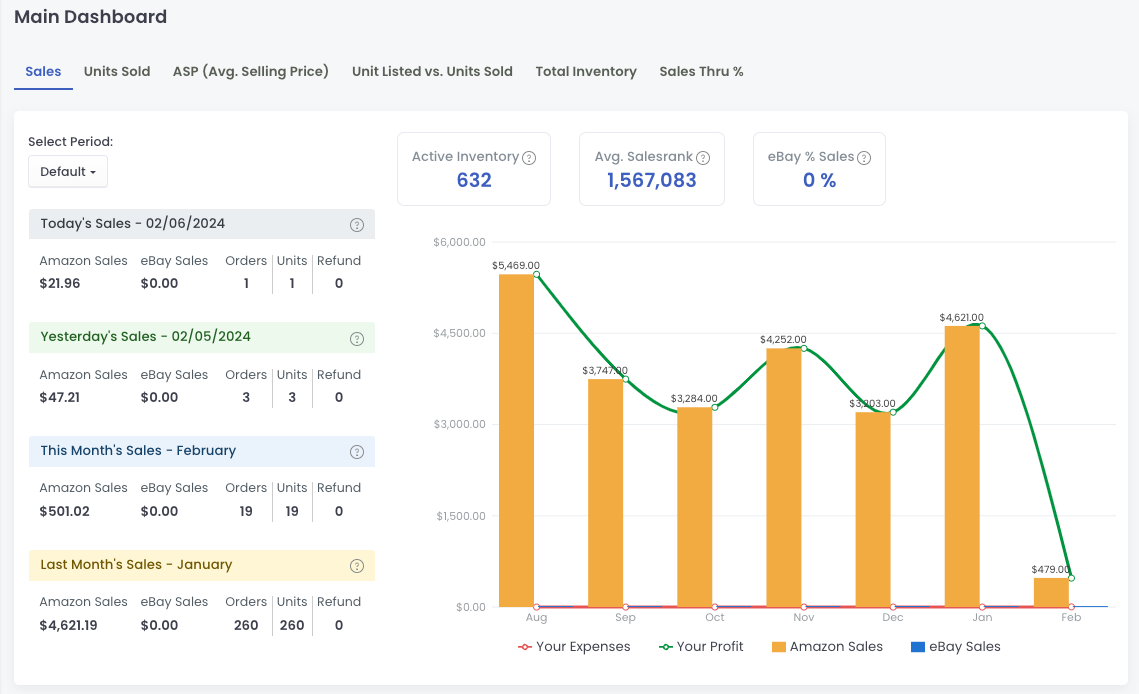
The dashboard in AccelerList is the first thing that greets you when you enter the application. It houses many metrics for you so that you can fully understand your Amazon business. Let's show an example of the dashboard and go over the metrics we show for you.
Sales Metrics
ASP (Average Sales Price)
The average sales price is calculated as an average selling price for all sales in the last 30 days.
Sales this Week
Pretty straightforward, these are the sales for the current week based on Amazon reporting
Current Month Sales
These are the sales for the month shown in a MTD format so as sales happen each day for you (if that is the case) then this number should grow each day.
Current month Units Sold
These are the actual # of items or products you have sold in the current month
Inventory Metrics
Active Inventory
This is the total amount of active inventory units as reported to us by Amazon Seller Central which is defined as any active product listing with a quantity greater than 0
Sell through Rate %
This is your sell-through rate for the last 90 days as represented by percent
Current Month Units Listed
This metric shows you how many units you listed in the current month so that you can get a pulse on how active you are as a lister and thus selling
Current Month Average Sales Rank
This is the average sales rank across all of your sales for the current month